Loading...
Loading...
Loading...
Loading...
Loading...
Loading...
Loading...
Loading...
Loading...
Loading...
Loading...
Loading...
Loading...
Loading...
Loading...
Loading...
Loading...
Loading...
Loading...
Loading...
Loading...
Loading...
Loading...
Loading...
Loading...
Loading...
Loading...
Loading...
Loading...
Loading...
Loading...
Loading...
Setting up the Standard Observability Suite in DuploCloud
Observability components are not turned on by default.
You need to enable the standard observability components before using them. To do this, navigate to Administrator -> Observability -> Standard -> Settings and follow the instructions in the rest of this section.
Enabling Metrics collection for centralized monitoring and select Tenants
The Metrics control plane uses Grafana, Prometheus, and Yace. They are only deployable in Default Tenant.
Navigate to Administrator -> Observability -> Standard -> Settings. Select the Monitoring tab to enable Metrics, and click the Enable Monitoring link.
In the Monitoring tab, select Enable Centralized Monitoring.
Below, the Monitoring view is shown after the metrics have been enabled. cAdvisor and Node Exporter collect metrics. Selecting a Tenant deploys the containers on all the Hosts in that Tenant.
Comprehensive metrics at a glance using the DuploCloud Standard Observability Suite
In the DuploCloud Portal, navigate to Observability -> Standard -> Metrics to view various metrics per Tenant.


Working with the Advanced Observability Suite (AOS) dashboards in DuploCloud
The DuploCloud AOS dashboards are a gateway to the detailed Grafana dashboards, serving two purposes:
SSO and Authentication Proxy: The Grafana dashboards reside on a private network. DuploCloud acts as an authentication layer, connecting the same single sign-on (the DuploCloud login) to a Grafana session.
Summarizing Links: While AOS contains many pre-configured Grafana dashboards, you can create quick links with descriptions of the ones you use most frequently. See Customizing Dashboards for more information.
Depending on your (Administrator or User), you can access the Advanced Observability Suite dashboard from two locations in the DuploCloud Portal.
The displays cloud data across all resources and allows you to select DuploCloud Infrastructures. To use it, navigate to Administrator -> Observability -> Advanced -> Dashboard in the DuploCloud Portal.
The displays data by Tenant. To use it, navigate to Observability -> Advanced -> Dashboard in the DuploCloud Portal.
The integration between DuploCloud AOS and Grafana ensures that you can seamlessly transition between high-level monitoring and detailed data analysis. Whether you need to troubleshoot a log entry, trace a request’s path, monitor resource usage, or track performance metrics, the ability to click through from the AOS Dashboard to the corresponding Grafana dashboards makes it easier to investigate and resolve issues.
From the DuploCloud AOS Dashboards, you can navigate directly to the Grafana dashboards for detailed data:
Service Overview Dashboard: Click the Grafana link from the AOS dashboard and navigate to Integration-APM -> Service Overview Dashboard. This dashboard provides a high-level summary of the performance of your services, showing key metrics such as request rates, error rates, and other service-level indicators. It allows you to monitor the health of your services and quickly identify any issues that may need attention.
From the DuploCloud AOS Dashboard, you can easily navigate to corresponding Grafana dashboards for deeper insights. Simply click the links in the following panels to access detailed data:
Logs: Dive into the Grafana Logging Dashboard
Setting up Logging in the DuploCloud Portal
Navigate to Administrator -> Observability -> Standard -> Settings, and select the Logging tab to enable Logging. Click on Enable Logging.
Logging is based on OpenSearch and Kibana, deployed in the Tenant of your choice, and configurable, as shown below.
After enabling logging, choose which Tenants to collect logs from. The platform deploys collectors for each Tenant that you enable. Filebeat is the collector for Logs.
If you have a multi-region setup, create a separate logging infrastructure setup for each region to avoid the cost of cross-region data transfer.
Configure a custom Kibana URL for viewing Logging data from DuploCloud
DuploCloud provides a default Kibana URL for viewing Logging data, but if you want to update filters or customize further, you can override the default with these settings.
Log in to the DuploCloud Portal.
Navigate to Administrator -> System Settings -> System Config.
Click Add. The Add Config pane displays.
In the Config Type list box, select AppConfig.
In the Key list box, choose one of the following keys:
Kibana Base URL: This URL points to the proxy or direct access Kibana URL.
Kibana Logs URL Template: This URL template links to Kibana’s Logs.
In the Value field, enter the custom URL for the selected key. For example:
Kibana Base URL: /proxy/kibana
Kibana Logs URL Template: https://kibana.example.com/app/discover#/?_a=(query:(language:kuery,query:'log_type:"application"'))&_g=(time:(from:now-1h,to:now))
Click Submit to save the configuration.
After configuring the Kibana URL in DuploCloud, you can access the selected Kibana Logs data directly from the DuploCloud Portal:
Navigate to Administrator -> Observability -> Standard -> Logging.
Configure a custom Kibana URL for viewing audit logs from DuploCloud
DuploCloud provides a default Kibana URL for viewing audit logs, but if you want to update filters or customize further, you can override the default with these settings.
Log in to the DuploCloud Portal.
Navigate to Administrator -> System Settings -> System Config.
Click Add. The Add Config pane displays.
In the Config Type list box, select AppConfig.
In the Key list box, choose one of the following keys:
Kibana Base URL: This URL points to the proxy or direct-access Kibana instance.
Kibana Audit URL Template: This URL template links to Kibana’s Audit logs.
In the Value field, enter the custom URL for the selected key. For example:
For Kibana Base URL:
/proxy/kibana
For Kibana Audit URL Template:
https://kibana.example.com/app/discover#/?_a=(query:(language:kuery,query:'log_type:"audit"'))&_g=(time:(from:now-1h,to:now))
Click Submit to save the configuration.
After configuring the Kibana URL in DuploCloud, you can access Kibana Audit data directly from the DuploCloud Portal:
Navigate to Administrator -> Observability -> Audit.
Setting up Auditing in the DuploCloud Portal Standard Observability Suite
The DuploCloud Standard Observability Suite generates audit trails using OpenSearch. Enabling logging is a prerequisite for audit functionality.
In the DuploCloud Portal, navigate to Administrator -> Observability -> Standard -> Settings -> Audit and click the Enable Audit link.
Once enabled, the Audit view is accessible at Administrator -> Observability ->Audit. See the Auditing topic for further details.
Logging in the DuploCloud Standard Observability Suite utilizing OpenSearch and Kibana
DuploCloud Standard Observability Suite uses built-in OpenSearch for log storage and search. Filebeat is the collector deployed on each host to gather logs from containers and other system services.
Logs can be accessed at the platform level (by Administrators), at the Tenant level, or directly from a specific Service using the Logs link.
Use this option to view logs across all tenants or to troubleshoot issues at the platform level.
DuploCloud's Advanced Observability Suite Add-on
DuploCloud's Advanced Observability Suite (AOS) is an add-on service to boost your monitoring and troubleshooting abilities. Built on OpenTelemetry, our AOS leverages CloudWatch, LGTM (Loki, Grafana, Tempo and Mimir), and Pyroscope to deliver robust observability for your cloud infrastructure. It includes real-time anomaly detection and customizable alerts and unifies metrics, traces, logs, and profiles to track all aspects of your environment easily.
The Grafana-powered dashboards spotlight key metrics and visualize trends in real-time, empowering swift, data-driven decisions. Additionally, AOS leverages object storage solutions like S3, GCS, and Storage Accounts, making it extremely cost-effective. Overall DuploCloud’s AOS simplifies troubleshooting and enhances system health by providing a holistic view of your application and infrastructure performance.
a project under the Cloud Native Computing Foundation (CNCF), supports multiple programming languages and environments and provides a flexible, vendor-neutral framework for monitoring and analyzing application performance. Designed for high scalability and ideal for distributed applications, OpenTelemetry is the industry standard for observability. See the
Working with the AOS Tenant Dashboard
The Tenant AOS Dashboard provides cost and observability data by Tenant for granular infrastructure management. It is accessible to non-administrators who have access to the selected Tenant.
To access the Tenant AOS Dashboard, navigate to Observability -> Advanced -> Dashboard.
You can use the Tenant list box at the top of the Tenant AOS Dashboard to select the Tenant for which you want to view metrics.
Continuous monitoring of your cloud infrastructure in the DuploCloud Portal
DuploCloud ships with a standard suite of observability tools built into the platform. An extensible add-on suite of advanced diagnostic and monitoring tools, the DuploCloud Advanced Observability Suite based on OpenTelemetry, is also available for a monthly cost.
The Standard Edition includes:
Logging using OpenSearch and Kibana
Create automatic alerts
Tracing: Explore request flows and trace performance issues using the Grafana Tracing Dashboard.
Metrics: Click through to the Grafana Metrics Dashboards to analyze key performance metrics.
K8s/Docker: Monitor Kubernetes clusters and Docker containers by accessing the Grafana Kubernetes Dashboards.
Profiles: Track service, user, and tenant activity via the Grafana Profiles Dashboards.
"default"log_level: Filter by log level (e.g., "error", "info").
time range: Adjust the time range (e.g., from:now-1h, from:now-7d).
Example:
https://kibana.example.com/app/discover#/?_a=(query:(language:kuery,query:'log_type:"application"'))&_g=(time:(from:now-1h,to:now))


from:now-1hfrom:now-7dExample:
https://kibana.example.com/app/discover#/?_a=(query:(language:kuery,query:'log_type:"audit"'))&_g=(time:(from:now-1h,to:now))


System Health Check: Track real-time metrics like CPU usage, memory consumption, network traffic, and error rates across services to ensure that applications are healthy.
Latency Tracking: Monitor request latencies to identify performance bottlenecks, particularly in services where latency spikes might indicate an issue. Easily drill down to the traces and determine which specific module is the cause for latency, or switch to profile view for deeper utilization visibility.
Error Rate Analysis: Track error counts and types to ensure services operate as expected and identify critical failure points. Drill down to the traces with just a click to determine where the error occurs.
Request Flow Visualization: Visualize the path of requests through different services to understand interdependencies and identify which services may contribute to slowdowns or failures.
Service Dependency Mapping: See which services interact with each other, allowing for a clear view of critical service dependencies and helping identify potential cascading failures.
Root Cause Analysis (RCA): Trace issues back to the source by identifying slow, failed, or error-prone transactions and drilling down to pinpoint problematic services or infrastructure.
Identify Performance Bottlenecks: Detect slow components, such as long-running queries, network delays, or overloaded services, and make data-driven decisions to optimize them.
Capacity Planning: Use metrics to analyze usage patterns, forecast demand, and optimize resource allocation, helping avoid over-provisioning or under-resourcing.
Compare Release Impact: Measure the impact of new releases on system performance by comparing metrics before and after deployments.
Set Alerts for Key Metrics: Define thresholds and set alerts for anomalies in critical metrics, such as high error rates or slow response times, so that teams can act quickly.
Incident Response and Remediation: Enable responders to access context-specific insights that accelerate incident response, diagnostics, and resolution times.
Track User Journey Metrics: Analyze performance metrics specific to different user journeys (e.g., checkout flows) to understand the impact of backend performance on user experience.
End-to-End Latency Perceptions: Collect latency and success metrics for critical user actions to help understand where improvements could enhance user satisfaction.
Monitor Business KPIs: Track custom metrics like transaction success rates, revenue per minute, or user engagement rates to tie technical performance to business outcomes.
Cost Optimization: Identify underused resources or inefficient services to optimize operational costs and improve infrastructure utilization.
Request new capabilities via DuploCloud/Using the OpenTelemetry open-source API.
From the Grafana console, you can perform various tasks to customize your observability experience and proactively manage system health. For additional information, see the Grafana documentation.
Automate Grafana resource creation and management using Terraform and DuploCloud.
DuploCloud's Advanced Observability Suite (AOS) allows you to manage Grafana resources, such as dashboards and alerts, using Infrastructure as Code (IAC) through the Grafana Terraform provider. This integration simplifies the authentication process by providing a proxy that automatically handles authentication with DuploCloud’s session tokens, eliminating the need to manage Grafana API tokens manually (see the Terraform example below). For more information, see the Terraform documentation.
terraform {
  required_providers {
    grafana = {
      source  = "grafana/grafana"
      version = "3.13.2"
    }
  }
}

provider "grafana" {
  url  = "https://grafana-proxy-......./"
  auth = "anonymous"
  http_headers = {
    Authorization = "Bearer <<DUPLO_SESSION_TOKEN>>"
  }
}

resource "grafana_folder" "folder" {
  title  = "terraform"
}Configure custom metrics for DuploCloud’s Advanced Observability Suite (AOS)
DuploCloud’s Advanced Observability Suite (AOS) supports custom metrics collection and visualization, enabling you to monitor application-specific metrics in addition to default Kubernetes metrics. This guide will walk you through the steps to configure your applications to expose custom metrics and make them available in DuploCloud AOS.
k8s_grafana_com_scrape: true
k8s_grafana_com_job: custom-metrics
k8s_grafana_com_metrics_path: /metrics
k8s_grafana_com_metrics_portNumber: 9100
Navigate to Administrator → Observability → Standard → Logging in the DuploCloud Portal.
This page includes two tabs:
Main: Shows logs using an embedded OpenSearch dashboard provided by DuploCloud. You can select a Tenant and use filters to find the logs you need.
Kibana: Available if your organization has set up a custom Kibana (OpenSearch) URL. This lets you view logs with more advanced tools and features.
Use this view to access logs scoped to a single tenant.
Navigate to Observability → Standard → Logging.
In this view:
Logs are automatically filtered to show only data for the current tenant.
At the top, use the Service dropdown to filter logs for a specific service.
Alternatively, click Search by Filters to create custom filters for more precise log searching.
You can quickly access logs filtered for a Specific service directly from the Service details page. This shortcut helps you troubleshoot service issues faster without manually applying filters.
To view logs for a Service:
Navigate to Kubernetes → Services (or the relevant service list) in the DuploCloud Portal.
Click the menu icon () next to the Service you want to view logs for.
Select Logs. This will open a logs dashboard pre-filtered to show logs for that specific service.
DuploCloud retains application logs in two stages: comprehensive tracking and auditing.
Initially, logs are available in OpenSearch for 60 days, ensuring immediate access for recent activity analysis.
Logs are archived in an S3 Bucket for 365 days for long-term storage, meeting compliance, and historical data review needs. You can customize retention periods to meet specific requirements, offering flexibility in log management.
The Cloud Spend area, on the left side of the Tenant AOS Dashboard, offers a comprehensive view of expenses for the selected Tenant. It includes the following expenditure categories:
Current Month: Displays the current month’s spend for the selected Tenant.
Spend By Service: Displays a breakdown of cloud spending by Service.
The Observability area, on the right side of the Tenant AOS Dashboard, gives health and performance data for a selected Tenant.
Grafana: The Grafana button in the Observability header opens the Grafana console, where you can add, customize, or edit your AOS dashboards, query your logs, metrics, and traces, and more. For additional information, see the Grafana documentation.
Under the Observability header are data cards displaying various metrics.
Resources: This field lists the type and number of DuploCloud resources, such as Services, containers, and Ingresses, in the selected Tenant.
K8s/Docker: Kubernetes and Docker metrics specific to the Tenant, assisting in container workload management.
Logs: Access Tenant-specific logs for tracking, troubleshooting, and compliance.
Metrics: Displays performance metrics relevant to the Tenant’s resources.
Traces: View traces specific to the Tenant for performance and latency monitoring of the Tenant’s applications.
Profiles: Access profiling data for in-depth application insights and performance tuning.
For Grafana-generated metrics (e.g., K8s/Docker, Logs, Metrics, Traces, Profiles), you can click on the card (header or visual data) to open the corresponding detailed view in the Grafana console. Additionally, you customize your data sources and dashboards.

Alerting is limited to cloud services using CloudWatch. Users can wire third-party alerting solutions, such as Sentry, Pager Duty, etc., as described here.
No APM is included.
The Advanced Edition is a comprehensive add-on suite based on OpenTelemetry and includes:
Enable alerting, this will open an alerts template which has rules for each AWS namespace and Metric to be monitored.
Review the alerts template and adjust the thresholds.
Click Update.
Working with the AOS Administrator Dashboard
The Administrator AOS Dashboard displays cloud data across all resources and infrastructures. It is only accessible to Administrators.
To access it, navigate to Administrator -> Observability -> Advanced -> Dashboard.
The Cloud Spend area, on the left side of the Advanced AOS Dashboard, offers a comprehensive, real-time view of expenses across all resources.
Fin Ops: The Fin Ops button, in the Cloud Spend header, opens the DuploCloud Billing dashboard, which displays billing details including billing summaries by month or Tenant, billing alerts, and DuploCloud license usage information.
Current Month: Displays cloud expenditures for the current month.
Monthly Spend: Displays spending by month. Use the Monthly Spend list box to display spending by week or day.
The Observability section, on the right side of the Advanced AOS Dashboard, gives real-time health and usage data across resources.
Infrastructure: In the Observability header, the Infrastructure list box allows you to select the Infrastructure for which you wish to view observability details.
Grafana: The Grafana button, in the Observability header, opens the Grafana console where you can add, customize, or edit your dashboards, query your logs, metrics, and traces, and more. For additional information, see the .
Under the Observability header are data cards displaying the following metrics:
Resources: Lists the type and number of DuploCloud resources, such as Tenants, Services, etc.
K8s/Docker: Shows Kubernetes and Docker metrics, providing visibility into containerized workloads.
Logs: Displays logs for troubleshooting and compliance checks across all resources.
Metrics: Displays rate, errors, and duration metrics across Services.
For Grafana-generated metrics (e.g., K8s/Docker, Logs, Metrics, Traces, Profiles), you can click on the card to open the corresponding detailed view in the Grafana console. Additionally, you can .
Exploring metrics in the DuploCloud Advanced Observability Suite (AOS)
DuploCloud's Advanced Observability Suite (AOS) metrics pipeline leverages AWS CloudWatch for capturing critical metrics such as CPU utilization, memory usage, and Lambda execution times, Grafana Mimir as the backend for scalable and high-availability metrics storage, Grafana as the visualization tool for intuitive dashboard creation, and Grafana Alloy for bundling tools like Beyla and OpenTelemetry SDKs to collect metrics from applications and infrastructure. Out-of-the-box metrics combine with custom application-level metrics, to create unified dashboards that correlate infrastructure and application performance for a comprehensive view of system health.
RED metrics (Rate, Errors, Duration) are critical for monitoring and understanding the health and performance of distributed systems and microservices. When integrated into a Grafana dashboard using OpenTelemetry, they provide essential insights for diagnosing issues and optimizing performance, such as:
Rate: Tracks the number of requests per second, indicating the system's throughput. A sudden drop can highlight service degradation or bottlenecks.
Errors: Measures the percentage or count of requests that fail. This helps quickly identify stability issues or breaking changes in your service.
Duration: Monitors the time to process requests, providing insights into system latency. High durations can indicate inefficiencies or resource constraints.
In the DuploCloud Portal, navigate to Administrator -> Observability -> Advanced -> Dashboard (Administrator AOS Dashboard) or Observability -> Advanced -> Dashboard (Tenant AOS Dashboard). The AOS Dashboard displays.
Select your Infrastructure from the Infrastructure list box (Administrator AOS Dashboard) or Tenant from the Tenant list box (Tenant AOS Dashboard).
Click the Metrics card button. The Grafana APM -> RED Metrics
From the Grafana Beyla RED Dashboard, navigate to Grafana Dashboards in the left pane. Various out-of-box metrics and visualizations are available to you without creating specific queries.
For example, by selecting K8s Resource Monitoring from the Dashboards page, you can view numerous Kubernetes widgets depicting resource usage of Kubernetes Pods and containers, among other helpful performance data.
Click the Add button and select from the displayed list to add additional customizations and visualizations to a dashboard.
Using profiles with Pyroscope in the DuploCloud Advanced Observability Suite (AOS)
A profile is essentially a snapshot of your application's performance metrics at a specific point in time. DuploCloud’s Advanced Observability Suite (AOS) uses Pyroscope to provide detailed application profiles. These profiles give you detailed insights into how resources like CPU and memory are being used and help you optimize performance and monitor resource usage.
Pyroscope integrates seamlessly with DuploCloud’s other observability tools, like Tempo (for tracing) and Beyla (for telemetry). This allows you to view profiling data alongside traces and logs in Grafana for a unified monitoring experience. The combination of automatic profiling with the option for manual fine-tuning using OpenTelemetry SDKs helps capture the most relevant data for optimizing application performance.
By default, CPU profiles are collected for all applications, while memory profiles are specifically collected for Go and Java applications, providing deeper insights into performance and resource utilization.
To enable application profiling, you can push profiling data directly to Pyroscope by . For detailed instructions on configuring the client, refer to the .
Pyroscope is the backend for profiles that show the CPU and Memory profile for the application. Exploring profiles helps identify and resolve performance issues, optimize resource usage, and improve efficiency. Key benefits include:
Identifying Performance Bottlenecks: Pinpointing slow functions or resource-heavy processes.
Optimizing Resource Utilization: Analyzing CPU and memory usage for better scaling decisions.
Debugging Latency Issues: Detecting areas with high latency that may affect user experience.
Root Cause Analysis: Correlating profiling data with logs and traces to identify the cause of performance issues.
In the DuploCloud Portal, navigate to Administrator -> Observability -> Advanced -> Dashboard (Administrator AOS Dashboard) or Observability -> Advanced -> Dashboard (Tenant AOS Dashboard). The AOS Dashboard displays.
Select your Infrastructure from the Infrastructure list box (Administrator AOS Dashboard) or Tenant from the Tenant list box (Tenant AOS Dashboard).
Click the Profiles card. The Grafana Profiling dashboard displays.
For more information about profile data, see the .
The Profiling Dashboard provides detailed insights into how your application utilizes resources such as CPU and memory.
You can also view Flame Graphs, which show the call stack and resource consumption, making it easier to identify the specific functions causing performance issues. The Explain Flame Graph feature further analyzes the data, offering insights into bottlenecks and suggesting optimizations for improved performance.
You can use the Explore feature in Grafana to . This allows you to correlate profiling and trace data for deeper insights into your application's performance. To learn more, check out the .
How the Advanced Observability Suite and OpenTelemetry integrate with DuploCloud
Advanced Observability Suite (AOS) is based on OpenTelemetry. The following graphic shows the various components.
To view the complete deployment of the OpenTelemetry stack:
In the DuploCloud Portal, navigate to Administrator -> Observability -> Advanced -> Dashboard.
In the Observability area, click the K8s/Docker card. The Grafana K8s Resource Monitoring dashboard launches, giving you a detailed view of resources and monitoring for Kubernetes nodes, Docker containers, and Pods.
OpenTelemetry data is stored in S3 Buckets, which you can view in the DuploCloud Portal.
In the DuploCloud Portal, select the OpenTelemetry_Tenant from the Tenant list box at the top of the Portal.
Navigate to Cloud Services -> Storage and select the S3 tab to view the data. This data setup is deployed and managed via release infrastructure.
To view a complete list of Kubernetes Services in an OpenTelemetry deployment, select the OpenTelemetry_Tenant from the Tenant list box at the top of the Portal and navigate to Kubernetes -> Services.
To view a complete list of Docker Containers in an OpenTelemetry deployment, select the OpenTelemetry_Tenant from the Tenant list box at the top of the Portal and navigate to Kubernetes -> Containers.
Exploring traces in the DuploCloud Advanced Observability Suite (AOS)
DuploCloud's Advanced Observability Suite (AOS) leverages for tracing, with and as the data collectors. Beyla, powered by eBPF (extended Berkeley Packet Filter), enables seamless collection of observability data directly from the system kernel without requiring application-level instrumentation. By attaching to system events like network requests and function calls, Beyla efficiently gathers metrics and traces. For more detailed trace information, users can , integrating traces into logs for enhanced observability.
Tracing with OpenTelemetry is useful in scenarios where you want to identify, analyze, and resolve performance issues or understand the flow of requests through a distributed system. Tracing is helpful for:
Customize DuploCloud Advanced Observability Suite (AOS) Dashboards
DuploCloud AOS users can tailor observability for their Kubernetes clusters by managing OpenTelemetry stacks and configuring Grafana dashboards to meet specific needs. Additionally, custom links can be added to AOS dashboard cards, enabling seamless integration with external tools or data sources.
By default, each Kubernetes cluster in DuploCloud has its own dedicated OpenTelemetry (OTEL) stack. If you need to share an OTEL stack across multiple clusters, contact DuploCloud Support.
In the AOS dashboard, the OpenTelemetry section features five cards that link to Grafana dashboards. To configure these cards and their links, go to Administrator -> System Settings -> System Config in the DuploCloud Portal and search for
Get Logging insights in DuploCloud's Advanced Observability Suite (AOS)
DuploCloud's Advanced Observability Suite (AOS) integrates Grafana Loki as the logging backend, with Grafana Alloy acting as the log collector. This setup enables real-time log visualization, filtering, and analysis through Grafana, providing a unified observability experience alongside metrics and traces.
Grafana Loki powers the logging solution by indexing enriched metadata, including Kubernetes attributes such as Tenant name, Namespace, container, and Host, which DuploCloud automatically configures for every log entry. This enriched metadata simplifies querying and allows users to easily drill down into issues or switch from logs to traces directly from the dashboard to identify problems quickly.
Logs are crucial for observability, offering detailed, time-stamped insights into system behavior. They enable you to:


Spend By Service: Displays a breakdown of spend by Cloud Service.
Spend By Tenant: Highlights expenditures by Tenant.
Traces: View traces to monitor request flows and latency, supporting application performance analysis.
Profiles: Access profiling data for in-depth application insights, allowing performance tuning.


Debugging latency issues
End-to-end visibility of requests across services
Analyzing errors and failures
Capacity planning and optimization
Root Cause Analysis (RCA)
Performance tuning new features
Validating SLAs
Exposing misconfigurations
Understanding user behavior
Using OpenTelemetry with Grafana, you can collect and visualize traces alongside other observability data like metrics and logs, providing a unified view for effective troubleshooting and optimization.
In the DuploCloud Portal, navigate to Administrator -> Observability -> Advanced -> Dashboard (Administrator AOS Dashboard) or Observability -> Advanced -> Dashboard (Tenant AOS Dashboard). The AOS Dashboard displays.
Select your Infrastructure from the Infrastructure list box (Administrator AOS Dashboard) or Tenant from the Tenant list box (Tenant AOS Dashboard).
Click the Traces card button. The Grafana Tracing dashboard displays.
Use the following functions on the Grafana Tracing dashboard to find and view relevant trace data. See the for detailed instructions.
Search Query Builder: Use the search query builder to filter and find traces based on parameters like service name, duration, status codes, or custom tags. This lets you quickly narrow down the traces you're interested in and dive into specific details.
TraceQL: TraceQL is a powerful query language designed to provide advanced filtering and exploration of your trace data. It lets you run more complex queries for pinpointing specific traces or span data based on conditions like service dependencies, error rates, or trace attributes.
Service Graph: The Service Graph visualizes the relationships between services in your application. It shows how services communicate with one another and provides a high-level view of trace flow across your system. This view helps you identify bottlenecks or failures in service-to-service interactions.
When you have located a trace of interest using the steps above, you can inspect specific metrics or individual spans to understand the operations that occurred during the trace.
From the Grafana Tracing dashboard, click on the trace of interest. The Trace Timeline Viewer displays on the right side of the screen. See the Grafana Tracing documentation for more details.
The Trace Timeline Viewer can be used to map traces with logs, metrics, and profiles. These details offer insights into timing, status, and metadata, which can help identify performance bottlenecks or failures.
Trace-to-Logs: Navigate from a trace directly to relevant logs, allowing you to correlate trace details with log data.
Trace-to-Metrics: Jump to metrics related to a particular exception/span to analyze rates, durations, and other key performance indicators.
Trace-to-Profiles: Link trace spans directly to profiling data for deeper analysis of resource usage and performance at the code level. This feature allows you to correlate traces with profiles, such as CPU or memory usage, providing fine-grained insights into your system’s behavior.
For detailed instructions on inspecting traces, spans, and associated logs, see this Grafana documentation page. For more information about logging with DuploCloud's AOS, see the DuploCloud Logging page.
otelEach configuration entry corresponds to a card on the dashboard. Entries that start with <infraname>/ apply to the cards for that specific Infrastructure, (in the Administrator AOS Dashboard, all cards reference the Infrastructure selected from the Infrastructure list box), as shown in the table below.
<infraname>/proxyurl
Grafana button on the dashboard
Admin
<infraname>/logs
Logs Button
Admin
<infraname>/metrics
Metrics Button
Admin
<infraname>/traces
Traces Button
For detailed instructions on customizing Grafana dashboards, refer to the official Grafana Documentation on Dashboards.
For custom dashboards or manually instrumented applications, you may need to add custom links to your AOS dashboards to lead to the specific data or external tools associated with your custom configurations. Follow these steps to add custom links to data cards as an administrator or non-administrator:
From the DuploCloud Portal, navigate to Administrator -> Observability -> Advanced -> Dashboard.
Click the link icon () on the card where you want to add a custom link. The All Admin Custom Links pane displays.
Select the Admin tab to add a custom link to the Administrator AOS Dashboard or the Common tab to add a custom link to the Tenant AOS Dashboard dashboard.
Click Add. The Add DATA_CARD_NAME Custom Link pane displays.
Enter details for the custom link:
Name: The label for the link.
URL: The target location (e.g., <infraname>/logs/tenant for Tenant-specific logs or <infraname>/metrics/tenant for tenant-specific metrics).
Click Submit. The custom link is added to the data card.
Add custom links to Tenant dashboards.
From the DuploCloud Portal, navigate to Observability -> Advanced -> Dashboard.
Click the link icon () on the card where you want to add a custom link. The All Tenant Custom Links pane displays.
Click Add. The Add DATA_CARD_NAME Custom Link pane displays.
Enter a Name, URL, and Description for the custom link.
Click Submit. The custom link is added to the Tenant Dashboard.
Debug errors and warnings
Monitor system and application health
Investigate security and compliance issues
Track deployment and configuration changes
Identify trends or anomalies
Correlate events across logs, traces, and metrics for root cause analysis
Using the Grafana Logging dashboard, you can quickly drill down into logs to investigate issues, explore associated traces for context, and analyze metrics to optimize performance.
In the DuploCloud Portal, navigate to Administrator -> Observability -> Advanced -> Dashboard (Administrator AOS Dashboard) or Observability -> Advanced -> Dashboard (Tenant AOS Dashboard). The AOS Dashboard displays.
Select your Infrastructure from the Infrastructure list box (Administrator AOS Dashboard) or Tenant from the Tenant list box (Tenant AOS Dashboard).
Click the Logs card button. The Grafana Logging dashboard displays various widgets and views, including Live logs.
Adjust the time interval list box in the top right corner of the Grafana dashboard (Last 30 minutes in the above graphic) to display data for the period of your choice.
Refine your view by selecting a specific namespace, Pod, or stream from the Namespace, Pod, and Stream list boxes near the top of the page, or using the default values of All.
You can quickly access logs filtered for a specific Service. This helps you troubleshoot issues without manually setting filters.
To view logs for a Service:
Navigate to Kubernetes → Services (or the relevant service list) in the DuploCloud Portal.
Click the menu icon (⋮) next to the service you want to inspect.
Click Logs.
DuploCloud displays a logs dashboard pre-filtered to show logs for the Service. You can adjust the filters or expand the time window to explore further
From the Grafana Logging Dashboard, there are several ways to explore logs and specific log entries in detail:
Explore view: Click the menu icon () in the upper right corner of the Logs pane and select Explore. Explore view displays details for your logs and allows you to run queries. See the Grafana Logging documentation for more information
Log Entry Details: In the Logs panel, click on a log entry to display details about the event that triggered it. Log entry data displays, as shown in the following image:
Traces: From the log details pane, click the View Trace button to view traces associated with the log entry.
Log Context: Click the context icon ( ) to open the Log context window for contextual details about the log entry.
Configure alerts with Grafana's native Alert manager for DuploCloud's AOS
Grafana's native Alert manager is used for alerting within the DuploCloud Advanced Observability Suite (AOS). DuploCloud's AOS includes a default set of alerts based on best practices and compliance standards. Custom alerting can also be set up to meet your unique needs based on log strings, metrics, etc.
When you enable AOS, a set of alerts is automatically available in Grafana. These alerts cover common health and performance issues for Linux nodes and Kubernetes clusters, helping you monitor critical infrastructure without extra setup.
The default alerts include:
These alerts are provided automatically in Grafana for AOS. Any additional alerts beyond these categories must be manually created.
Any alerting beyond the default node and Kubernetes integrations must be created manually. For example, you might add alerts based on:
Application-specific error logs (e.g., HTTP 500 spikes).
Business KPIs (e.g., queue depth, transaction rates).
Service-level metrics such as latency or availability.
These types of alerts can be defined directly in Grafana to suit your organization’s needs. To create or manage them, follow these steps:
From the DuploCloud Portal, navigate to one of the following dashboards:
Admin AOS Dashboard: Administrator → Observability → Advanced → Dashboard
Tenant AOS Dashboard: Observability → Advanced → Dashboard
Prerequisite resource requirements for deploying the DuploCloud OTEL stack
The DuploCloud OpenTelemetry (OTEL) stack requires specific resources for deployment. The implementation features node-level components, deployed as DaemonSets, for telemetry collection and central observability components for data aggregation, processing, and visualization. Object storage is the backbone for retaining metrics, logs, traces, and profiling data, ensuring scalability and long-term accessibility.
Using Service Level Objectives (SLOs) in the DuploCloud Advanced Observability Suite (AOS)
Service Level Objectives (SLOs) are metrics that define the desired reliability and performance targets for a service. Powered by Service Level Indicators (SLIs) such as latency, availability, and error rates, SLOs provide a precise measure of whether your service is meeting its goals. With SLOs integrated into DuploCloud’s Advanced Observability Suite (AOS), you benefit from automated dashboards, real-time performance monitoring, and proactive alerting. These capabilities empower you to continuously monitor and optimize your service's health for a seamless user experience.
DuploCloud streamlines the management of SLOs by integrating them with Grafana, where users can easily create and modify SLO configurations. Instead of manually editing backend files or complex configurations, DuploCloud uses a business form to simplify the process. This form is available in the DuploCloud UI through Grafana, where you can submit your SLO request with a few clicks.
Once submitted, the request is automatically processed by the Duplo-automation service. This powerful service takes care of creating and configuring the necessary backend resources, rules, and alerts based on your input. This automation reduces manual intervention and ensures that your SLO setup is quick, efficient, and error-free.
Viewing faults and alerts in the DuploCloud Portal
Faults that happen in the system, be it Infrastructure creation, container deployments, Application health checks, or any Triggered Alarms can be tracked in the DuploCloud portal under Faults Menu.
You can look at Tenant-specific faults under Observability -> Faults or all the faults in the system under Administrator -> Faults.
Creating and Using a WAF
The creation of a Web Application Firewall (WAF) is a one-time process. Create a WAF in the public cloud Console, fetch the ID/ARN, and update the Plan in DuploCloud. Once updated, the WAF can be attached to the Load Balancer.
When you create a WAF in DuploCloud, an entry is added to the . You use this entry to attach an ALB Load Balancer to your WAF.


Admin
<infraname>/k8s
K8S Button
Admin


The Grafana Alert rules page displays, allowing you to view, add, delete, or modify alerts. For detailed instructions, see the Grafana alert documentation.


The following components run as DaemonSets on each node in the Kubernetes cluster.
alloy-logs
0.5 cores
512 MB
Log collection and forwarding
alloy-profiles
0.5 cores
300 MB
Continuous application profiling
node-exporter
0.1 cores
50 MB
Recommended Configuration
CPU: 8 cores | Memory: 32 GB RAM
Minimum Viable Configuration
CPU: 4 cores | Memory: 16 GB RAM
Loki
1-3 cores
4-12 GB
Log aggregation
Mimir
1-3 cores
4-12 GB
Metrics storage
Tempo
1-2 cores
2-8 GB
Alloy StatefulSet
1 core
2 GB
Centralized metrics collection
OTEL Collector
1 core
2 GB
Telemetry processing
kube-state-metrics
0.1 cores
50 MB
The implementation uses object storage (e.g., S3, GCS, Azure Storage Account) for:
Metrics storage (Mimir)
Log storage (Loki)
Trace storage (Tempo)
Profile data storage (Pyroscope)
The SLO Overview dashboard provides a comprehensive view of service performance. It contains high-level data and key metrics for your defined Service Level Objectives (SLO). For each SLO, it tracks the SLI percentage, shows the remaining error budget, and visualizes the SLI percentage as a graph, offering a clear trend of service performance over time.
From the DuploCloud Portal, Navigate to Observability -> Advanced -> Dashboard
Click the SLO link in the Metrics data card or navigate to the SLO Overview dashboard in Grafana. The Grafana SLO Overview dashboard displays.
You can dive deeper into the details of any individual SLO by clicking the View Dashboard button for that SLO on the left-hand side of the SLO Overview dashboard. The SLO details provide a more comprehensive view of the SLO's performance metrics such as the SLO percentage, error budget trend, burn rate, remaining error budget, current burn rate, event rate, etc.
To create an SLO in Grafana, follow the steps below. For more information, see the Grafana SLO documentation.
From the DuploCloud Portal, Navigate to Observability -> Advanced -> Dashboard
Click the SLO link in the Metrics data card or navigate to the SLO Overview dashboard in Grafana. The Grafana SLO Overview dashboard displays.
Click on the Create SLO button located at the top-right corner of the screen. The Dashboard for Managing SLO displays.
Enter the following information about the SLO:
Name: The name of the SLO.
Description: A brief description of the SLO.
Objective: The target goal for the SLO (e.g., 99.9% uptime).
Click Create/Update SLO. The SLO is created and added to the SLO Overview Dashboard.
Navigate to the SLO Overview dashboard.
Locate the SLO you wish to modify in the list on the left side, and click Edit SLO.
The Dashboard for Managing SLO will appear, displaying the same fields as when you created an SLO. You can now make the necessary changes, such as updating the name, description, objective, time window, type, success metric, and total metric.
After making your changes, click Create/Update SLO to save the updates.
If you wish to delete the SLO, click Delete SLO.
DuploCloud automatically creates alert rules for each SLO, including Critical and Warning alerts. You can view them in Grafana to understand their configurations.
From your Grafana home page, navigate to Alerting -> Alert rules. The Alert rules page displays.
Locate and click the specific SLO (e.g., duplo_slo_slo-auto-14:rjgsrnj6hyf1jef10bf91).
The associated recording and normal alert rules display.
Click on any alert rule to review the alert conditions, thresholds, and labels.
To manage how these alerts are routed, create notification policies based on the SLO service name (e.g., cartservice). You can specify which channels (e.g., Slack, PagerDuty) alerts should be sent to based on the labels of the SLO.
For detailed steps on setting up notification policies, refer to the Grafana Notification Policies. documentation.
To configure faults for a Tenant, navigate to Administrator -> Tenants and select the Tenant from the NAME column. In the Settings tab, click Add. Select or enter the appropriate feature on the Add Tenant Feature pane.
DuploCloud provides tenant-level settings that control fault behavior across different workloads and services. Some settings specifically affect Kubernetes pods and jobs, while others apply to the Tenant more generally.
For instructions on adding or updating these settings, see the Tenant Settings page for your cloud provider:
raise_fault_on_last_state_pod_failure_reasons
Generates a fault when a Kubernetes pod is terminated with a specified failure reason. Enter the failure reasons you want to monitor, e.g., OOMKilled. Multiple reasons can be semicolon-separated.
enable_k8s_job_fault_logging
Generates faults for Kubernetes Job failures by default when set to True.
tenant_instances_stopped
Mutes faults for Tenants that have been stopped when set to True.
Alerts in DuploCloud are created for individual resources and their metrics. To create an alert:
Navigate to the resource type you want to monitor:
For Kubernetes services: Kubernetes → Services
For RDS databases: Cloud Services → Databases → RDS
For other resources, follow a similar pattern
Select the resource from the NAME column to open its details page.
Click the Alerts tab.
Click Add. The Create Alert pane displays.
Enter the desired threshold, conditions, and notification options.
Click Create to save the alert.
General alerts show all alerts across your account and all resources, providing a high-level view of system-wide issues.
Navigate to Observability -> Alerts.
Resource-specific alerts display only the alerts associated with a particular resource, such as a Service, Host, or Database, allowing you to focus on issues affecting that specific component.
Navigate to the resource’s details page (see the steps in Creating Alerts above).
Select the Alerts tab.

From the NAME column, select the Plan you want to update.
Click the WAF tab.
Click Add. The Add WAF pane displays.
In the Name field, type the name of your WAF.
In the WAF ARN field, enter the WAF Amazon Resource Name (ARN).
Enter the WAF dashboard URL in the WAF Dashboard URL field.
Click Create.
Only ALB Load Balancers can be attached to a WAF.
If you don't yet have an Application Load Balancer (ALB), create one.
In the Other Settings card, click Edit. The Other Load Balancer Settings pane displays.
From the Web ACL list box, select a WAF that you have added to DuploCloud.
Complete the other required fields in the Other Load Balancer Settings pane.
Click Update.
DuploCloud also provides a WAF Dashboard through which you can analyze the traffic that is coming in and the requests that are blocked. The Dashboard can be accessed from the left navigation panel: Observability -> WAF.
Enable and view alert notifications in the DuploCloud Portal
DuploCloud supports viewing of Faults in the portal and sending notifications and emails to the following systems:
Sentry
PagerDuty
NewRelic
OpsGenie
You will need to generate an keys from each of these vendor systems, and then provide that key to DuploCloud to enable integration.
In the website, navigate to Projects -> Create a New Project.
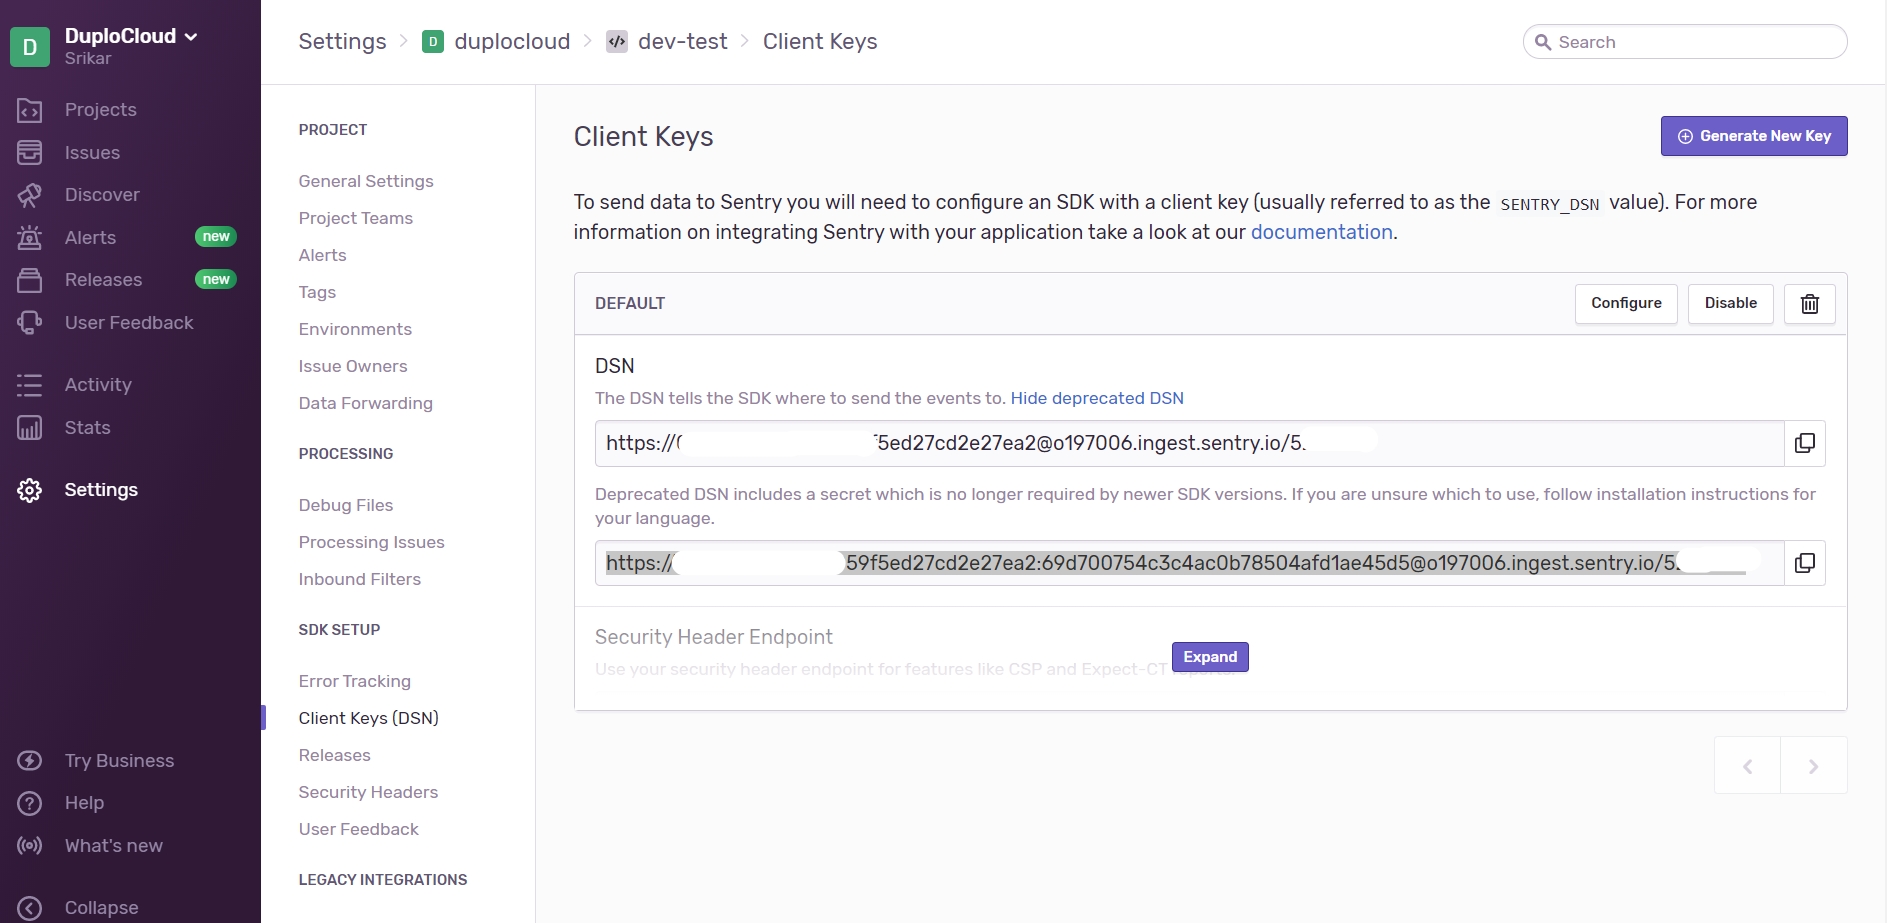
Click Settings -> Projects -> project-name -> Client keys. The Client Keys page displays.
Complete the DSN fields on the screen.
In the website home page, select the Services tab and navigate to the service that receives Events. If a Service does not exist, click New Service. When prompted, enter a friendly Name (for example, your DuploCloud Tenant name) and click Next.
Assign an Escalation policy, or use an existing policy.
Click Integration.
In the website, use the to generate an to send events to NewRelic Insights.
In the DuploCloud Portal, navigate to Observability -> Faults.
Click Update Notifications Config. The Set Alert Notifications Config pane displays.
In the website, .
In the DuploCloud Portal, navigate to Observability -> Faults.
Click Update Notifications Config. The Set Alert Notifications Config pane displays.
Instrument applications in DuploCloud using Grafana Beyla and OpenTelemetry
DuploCloud leverages automated instrumentation with and the to provide robust monitoring and tracing without extensive manual configuration. With Grafana Beyla, users can get automatic instrumentation for a wide range of languages, capturing key metrics and trace spans with minimal setup. For languages and use cases not covered by Beyla, users can manually instrument their applications using OpenTelemetry, offering full flexibility to capture detailed telemetry data where automated options are unavailable.
Hardware and OS metrics export
Beyla
0.5 cores
512 MB
Automatic application instrumentation
Distributed tracing
Pyroscope
1-2 cores
2-8 GB
Continuous profiling
Kubernetes object metrics

Success Metric: The metric used to track success.
Total Metric: The total metric used to evaluate the SLO.


Click Generate New Key.
In the DuploCloud Portal, navigate to Observability -> Faults.
Click Update Notifications Config. The Set Alert Notifications Config pane displays.
In the Sentry - DSN field, enter the key you received from Sentry.
In the Alerts Frequency (Seconds) field, enter a time interval in seconds when you want alerts to be displayed.
Click Update.
Click Events API V2. Your generated Integration Key is displayed as the second item on the right side of the page. This is the Routing Key you will supply to DuploCloud.
Copy the Integration Key to your Clipboard.
In the DuploCloud Portal, navigate to Observability -> Faults.
Click Update Notifications Config. The Set Alert Notifications Config pane displays.
In the Pager Duty - Routing Key field, enter the key you generated from PagerDuty.
In the Alerts Frequency (Seconds) field, enter a time interval in seconds when you want alerts to be displayed.
Click Update.
In the NewRelic - API Key field, enter the key you generated from NewRelic.
In the Alerts Frequency (Seconds) field, enter a time interval in seconds when you want alerts to be displayed.
Click Update.
In the Alerts Frequency (Seconds) field, enter a time interval in seconds when you want alerts to be displayed.
Click Update.

To enable Beyla in your environment, contact your DuploCloud team.
Grafana Beyla is an open-source, eBPF-based auto-instrumentation tool designed to simplify the collection of key observability data for applications written in Go, C/C++, Rust, Python, Ruby, Java, NodeJS, .NET, and more.
It uses eBPF technology to capture RED metrics (Rate, Error, Duration) and basic trace spans for HTTP/S and gRPC services running on Linux, without requiring code changes or configuration updates.
Beyla is ideal for getting started quickly with observability and provides a low-overhead way to monitor application performance.
For more information, see the Beyla documentation.
While Beyla captures foundational metrics and spans out of the box, it does not provide distributed tracing or detailed trace spans. To address this, DuploCloud integrates the Kubernetes OpenTelemetry Operator.
This operator enables auto-instrumentation for services written in .NET, Java, Node.js, Python, and Go based on Pod Annotations.
DuploCloud ships an Instrumentation object in the OTEL namespace by default, forwarding telemetry data to an OpenTelemetry Collector (Alloy).
The following annotations are used for different programming languages to enable automatic instrumentation:
.NET: instrumentation.opentelemetry.io/inject-dotnet: "duploservices-AOS_TENANT_NAME/otel-instrumentation"
Go: instrumentation.opentelemetry.io/inject-go: "duploservices-AOS_TENANT_NAME/otel-instrumentation"
Java: instrumentation.opentelemetry.io/inject-java: "duploservices-AOS_TENANT_NAME/otel-instrumentation"
Node.js: instrumentation.opentelemetry.io/inject-nodejs: "duploservices-AOS_TENANT_NAME/otel-instrumentation"
Python: instrumentation.opentelemetry.io/inject-python: "duploservices-AOS_TENANT_NAME/otel-instrumentation"
Users can also customize or add OpenTelemetry environmental variables for their Pods, as needed. See the for details.
For applications using unsupported languages or scenarios not covered by automated tools, manual instrumentation is recommended. OpenTelemetry offers libraries and documentation to help developers manually instrument applications across a variety of languages and frameworks. Refer to the OpenTelemetry documentation for detailed guidance on how to integrate OpenTelemetry into your application.
When instrumenting your application, you need to configure telemetry endpoints dynamically to send telemetry data (such as traces, metrics, and logs) to the OpenTelemetry Collector. This configuration is done by setting the appropriate environment variables (EVs) in your application.
Environment Variable (EV)
Endpoint URL
OTEL_EXPORTER_OTLP_TRACES_ENDPOINT
http://duplo-tracing.duploservices-Opentelemetry_tenant/v1/traces
OTEL_EXPORTER_OTLP_METRICS_ENDPOINT
http://duplo-metrics-distributor.duploservices-Opentelemetry_tenant/api/v1/push
OTEL_EXPORTER_OTLP_LOGS_ENDPOINT
http://duplo-logging.duploservices-Opentelemetry_tenant:3100/loki/api/v1/push
To manually instrument your application in a Kubernetes environment, set the OTEL (OpenTelemetry) environment variables in your Kubernetes deployment configuration. These environment variables will direct telemetry data (traces, metrics, and logs) to the OpenTelemetry Collector.
Set the required environment variables for OpenTelemetry in your application’s Kubernetes deployment YAML.
Use the appropriate endpoint URLs for OpenTelemetry.
If your application is running outside of a Kubernetes cluster, contact DuploCloud Support for assistance. DuploCloud will expose endpoints via Kubernetes Ingress and provide the necessary URLs for your external application.
Once the URLs are provided by DuploCloud, configure your application to use them.
Set the environment variables in your external application, replacing the endpoint URLs with those provided by DuploCloud.
If your application exposes custom metrics in a Prometheus-compatible format, you can easily integrate these metrics into your monitoring stack. By following the steps below, your custom metrics will be automatically scraped and stored in the database for visualization and analysis.
Expose Metrics on a Container Port and Path: Ensure your application exposes the custom metrics on a specific port and path within the container. For example, metrics might be available at http://<pod-ip>:9100/metrics.
Add Kubernetes Annotations: To enable automatic scraping of these metrics, add the following annotations to your Kubernetes pod specification:
Once these annotations are set, your application’s custom metrics will be collected and can be visualized in Grafana.
Alternatively, DuploCloud can expose the OTEL (OpenTelemetry) endpoint, and you can push your custom metrics using the OTLP protocol.
  k8s_grafana_com_scrape: "true"
  k8s_grafana_com_job: "custom-metrics"
  k8s_grafana_com_metrics_path: "/metrics"
k8s_grafana_com_metrics_portNumber: "9100"Set up billing alerts to track cloud spending in DuploCloud
Set billing alerts based on the previous month's spending or define a custom threshold. Receive email notifications if the current month's expenses exceed a specified percentage of the threshold.
Set up billing alerts in DuploCloud to monitor and manage AWS cloud spending. Alerts can help you stay within budget by notifying you when expenses exceed a defined threshold. DuploCloud supports two types of billing alerts:
Administrator Billing Alerts monitor total usage across all Tenants.
Tenant Billing Alerts track spending within an individual Tenant.
Each alert compares current monthly usage against either the previous month’s spending or a custom threshold, and sends email notifications when a specified percentage is reached.
Billing alerts can be created at two levels: Administrator alerts monitor overall cloud spending across all tenants, while Tenant alerts focus on the usage within a specific Tenant. Choose the appropriate section in the DuploCloud Portal based on the scope you want to monitor.
In the DuploCloud Portal, navigate to Administrator → Billing for Administrator-level alerts or Cloud Services → Billing for Tenant-level alerts.
Click Add to create a new billing alert. The Add Billing Alert Config pane displays.
Complete the fields (shown in the table below) according to your alert preferences.
Click Submit to save your alert. The alert appears in the Billing Alerts tab and will trigger email notifications when conditions are met.
To view detailed information about a billing alert:
In the DuploCloud Portal, navigate to Administrator → Billing for Administrator-level alerts or Cloud Services → Billing for Tenant-level alerts.
Select the Billing Alerts tab.
Select the billing alert you want to view from the NAME column.
You can view billing alert details, edit alert configurations, or delete alerts as needed directly from the DuploCloud Platform.
In the DuploCloud Portal, navigate to Administrator → Billing for Administrator-level alerts or Cloud Services → Billing for Tenant-level alerts.
Select the Billing Alerts tab.
Click the menu icon () in the row of the billing alert you want to manage.
For cost management and billing data details related to your specific cloud provider, see the associated sections in the DuploCloud documentation:
Optionally, select one or more DuploCloud Services to monitor as part of this alert.
Email Notifications
Specify the email address(es) that should receive alert notifications. You can either:
Choose users from your Tenant
Enter custom email addresses
Note: Multiple addresses can be added, separated by commas. Custom emails receive the same alert notifications as tenant users.
Pause Alerts
Enable this setting to temporarily pause the alert.
Alert Name
Enter a unique name for the billing alert.
Choose Threshold
Select the threshold type: • Custom Threshold: Set your own spending threshold. • Previous Month Spend: use the total spend from the prior month as the threshold.
Threshold (Dollar Amount)
Enter the dollar amount that triggers the alert (for Custom Thresholds only).
Alert Trigger % (Percent of Threshold)
Select the percentage of your defined threshold at which the alert should trigger. For example, 80% means you'll be notified when spending reaches 80% of the threshold.
Azure Subscription (Azure only)
Required for Azure billing alerts. Select the Azure Subscription to monitor.
Google Project ID (GCP only)
Required for GCP billing alerts. Select the GCP project to monitor.
Tenant: Cost Tag (Optional) (Admin billing alerts only)
For Administrator-level billing alerts, select one or more Tenants to apply the alert to (e.g., All, Shared, or specific Tenants).
Configuration
Overview of the billing alert settings.
Notification Filter by Service
Services selected for this alert.
Notification Email List
Email addresses receiving alerts.
Details
Raw JSON configuration of the alert.
Details
View the billing alert configuration in JSON format.
Edit
Open the Update Billing Alert Config pane to modify alert settings.
Delete
Permanently delete the billing alert (confirmation required).


monthly_alert billing alert
monthly_alert details page

Service (Optional)