Create automatic alerts
DuploCloud allows automatic alert generation for resources within a Tenant. This ensures that the defined monitoring baseline is applied to all current and new resources based on a set of rules.
As an Administrator:
From the DuploCloud portal, navigate to Administrator -> Tenants, and click the Alerting tab
Enable alerting, this will open an alerts template which has rules for each AWS namespace and Metric to be monitored.
Review the alerts template and adjust the thresholds
Click on Update
Viewing faults and alerts in the DuploCloud Portal
Faults that happen in the system, be it Infrastructure creation, container deployments, Application health checks, or any Triggered Alarms can be tracked in the DuploCloud portal under Faults Menu.
You can look at Tenant-specific faults under Observability -> Faults or all the faults in the system under Administrator -> Faults.
To configure faults for a Tenant, navigate to Administrator -> Tenants and select the Tenant from the NAME column. In the Settings tab, click Add. Select or enter the appropriate feature on the Add Tenant Feature pane.
From the DuploCloud portal, navigate to Administrator -> Tenants.
Select the Tenant from the NAME column.
Select the Settings tab, and click Add. The Add Tenant Feature pane displays.
From the Select Feature list box, select Other.
In the Configuration field, enter tenant_instances_stopped.
In the Value field, enter True.
Click Add. Faults for stopped Tenants will be muted.
You can set the AWS Alerts for the individual metrics, click on the bell icon on any of the metrics. A form to create an alert shows up. You can provide the necessary information and create the alert.
View general alerts from the DuploCloud Portal in the Observability -> Alerts.
Select the Alerts tab for alerts pertaining to a specific resource, such as Hosts.
Enable and view alert notifications in the DuploCloud Portal
DuploCloud supports viewing of Faults in the portal and sending notifications and emails to the following systems:
Sentry
PagerDuty
NewRelic
OpsGenie
You will need to generate an keys from each of these vendor systems, and then provide that key to DuploCloud to enable integration.
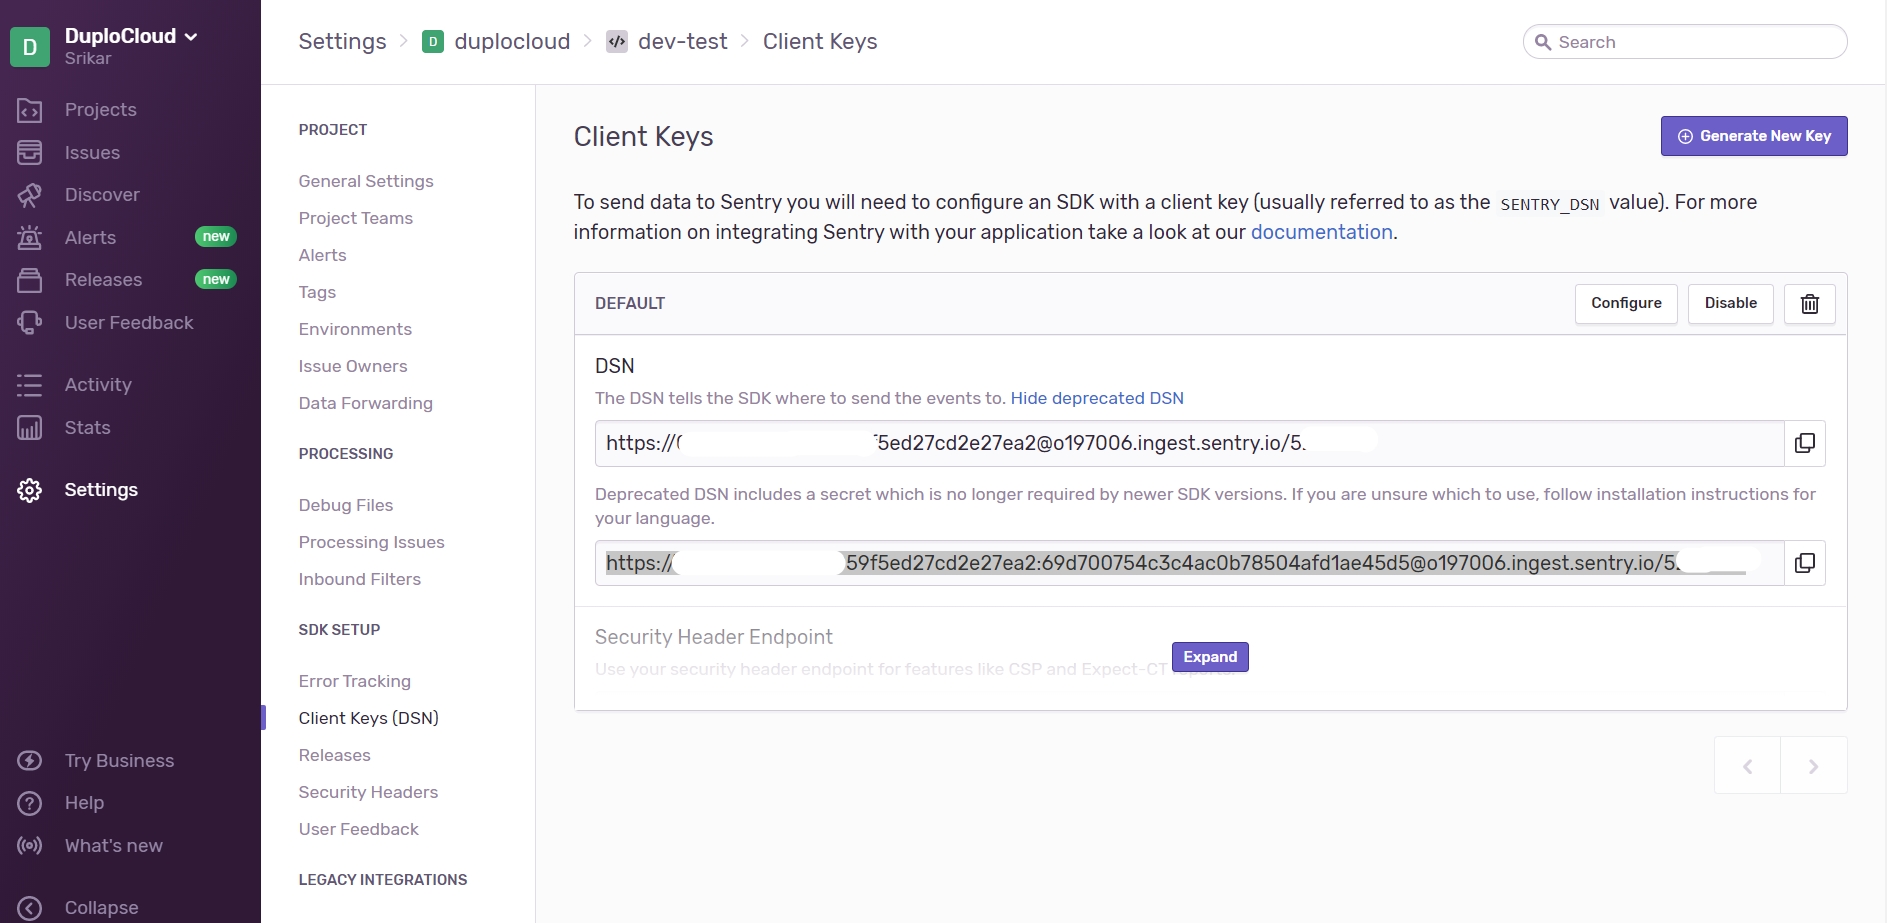
In the Sentry website, navigate to Projects -> Create a New Project.
Click Settings -> Projects -> project-name -> Client keys. The Client Keys page displays.
Complete the DSN fields on the screen.
Click Generate New Key.
In the DuploCloud Portal, navigate to Observability -> Faults.
Click Update Notifications Config. The Set Alert Notifications Config pane displays.
In the Sentry - DSN field, enter the key you received from Sentry.
In the Alerts Frequency (Seconds) field, enter a time interval in seconds when you want alerts to be displayed.
Click Update.
In the PagerDuty website home page, select the Services tab and navigate to the service that receives Events. If a Service does not exist, click New Service. When prompted, enter a friendly Name (for example, your DuploCloud Tenant name) and click Next.
Assign an Escalation policy, or use an existing policy.
Click Integration.
Click Events API V2. Your generated Integration Key is displayed as the second item on the right side of the page. This is the Routing Key you will supply to DuploCloud.
Copy the Integration Key to your Clipboard.
In the DuploCloud Portal, navigate to Observability -> Faults.
Click Update Notifications Config. The Set Alert Notifications Config pane displays.
In the Pager Duty - Routing Key field, enter the key you generated from PagerDuty.
In the Alerts Frequency (Seconds) field, enter a time interval in seconds when you want alerts to be displayed.
Click Update.
In the DuploCloud Portal, navigate to Observability -> Faults.
Click Update Notifications Config. The Set Alert Notifications Config pane displays.
In the NewRelic - API Key field, enter the key you generated from NewRelic.
In the Alerts Frequency (Seconds) field, enter a time interval in seconds when you want alerts to be displayed.
Click Update.
In the OpsGenie website, generate an API Key to integrate DuploCloud faults with OpsGenie.
In the DuploCloud Portal, navigate to Observability -> Faults.
Click Update Notifications Config. The Set Alert Notifications Config pane displays.
In the OpsGenie - API Key field, enter the key you generated from OpsGenie.
In the Alerts Frequency (Seconds) field, enter a time interval in seconds when you want alerts to be displayed.
Click Update.